Understanding Your Competitors with AI
What can a competitor’s prices reveal about the system behind them?

A competitor rarely shows you the model behind its decisions. It doesn’t publish the rules used to price a customer, rank an opportunity or decide which part of the market it wants to own, but it does show you the results.
A price is not only a number presented to a customer. It is the visible edge of a hidden system. Costs, risk, strategy and commercial appetite have already passed through the organisation before the number appears. Machine learning can help trace the outline of that system from the marks it leaves behind.
The Price Is a Shadow
Consider a company that provides motor insurance. The premium offered to a customer is related to the insurer’s estimate of risk, but risk is not one thing. It can include age, driving history, vehicle type, location, annual mileage and many other factors.
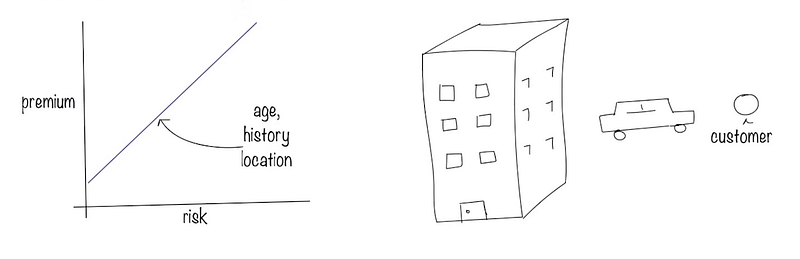
Car insurance proportional to the risk
For a simple example, imagine that the only factor we examine is the driver’s age.
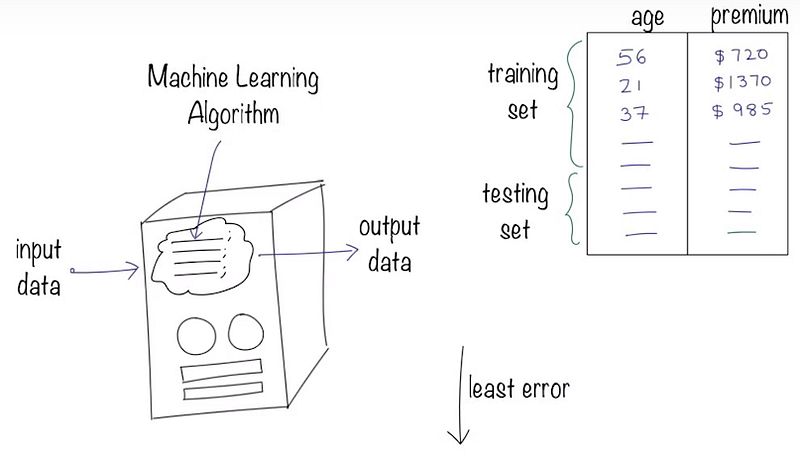
Pushing competitor data through the machine learning algorithm
Suppose we have a collection of competitor quotes containing a customer’s age and the premium offered. We don’t know the rules used inside the competitor’s pricing system. We have only the inputs we can observe and the outputs returned to the customer, through which a learning algorithm can fit a curve.
The data can be divided into training and testing sets. The training set is used to estimate the relationship between age and premium, while the testing set helps us judge whether the pattern continues beyond the examples used to build it.
Several algorithms may be tried. The useful one is not necessarily the most complicated. It is the one that explains the unseen examples with the least error while remaining stable enough to interpret.
A Model Without the Model
Imagine that the competitor’s prices form a nonlinear curve.
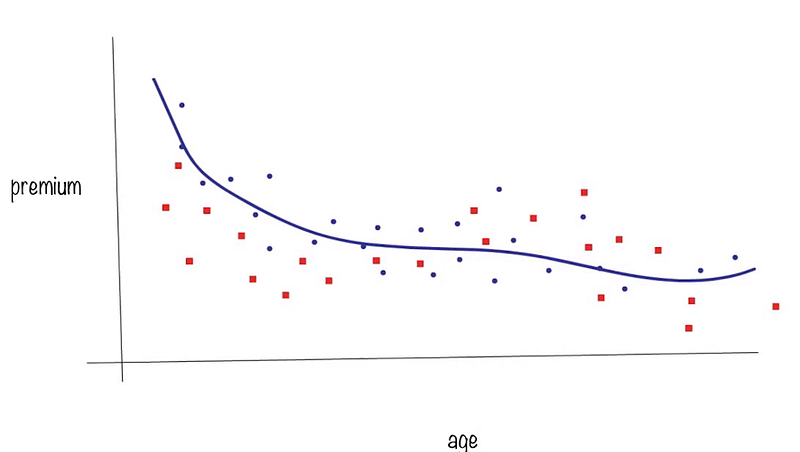
Competitor data showing premium against age
The fitted curve does not give us the competitor’s actual risk engine. It gives us a surrogate, an external approximation of how the system behaves across the part of the market we can observe.
The competitor may use variables we do not possess. Its premiums may include operating costs, marketing decisions, regulatory constraints, cross-subsidies between products or a deliberate willingness to accept lower margins in one segment. Two companies can observe the same risk and still choose different prices.
We are not reading the machine. We are studying its shadow, and the shadow can still be useful.
Where the Curves Separate
We can run the same analysis on our own pricing data, then place both curves on the same graph. The distance between them reveals where the two companies behave differently.
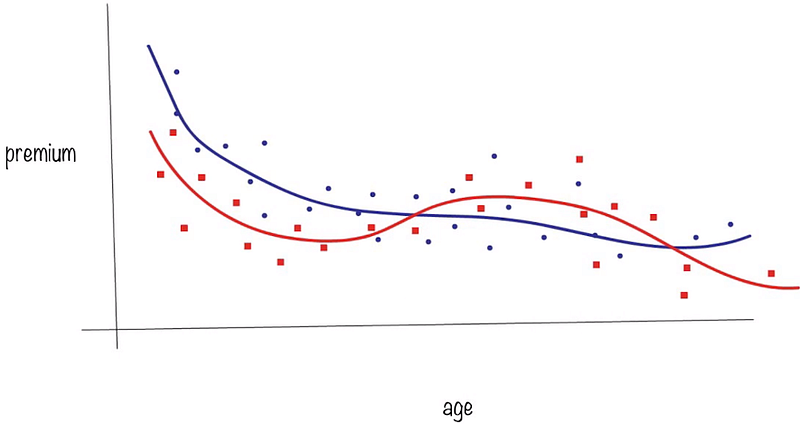
Your data in red superimposed on your competitor’s data in blue
In this simplified example, our premiums may be more attractive to younger and older drivers while the competitor offers lower prices to the middle-aged group. That doesn’t immediately tell us which company is correct. It tells us where the disagreement lives.
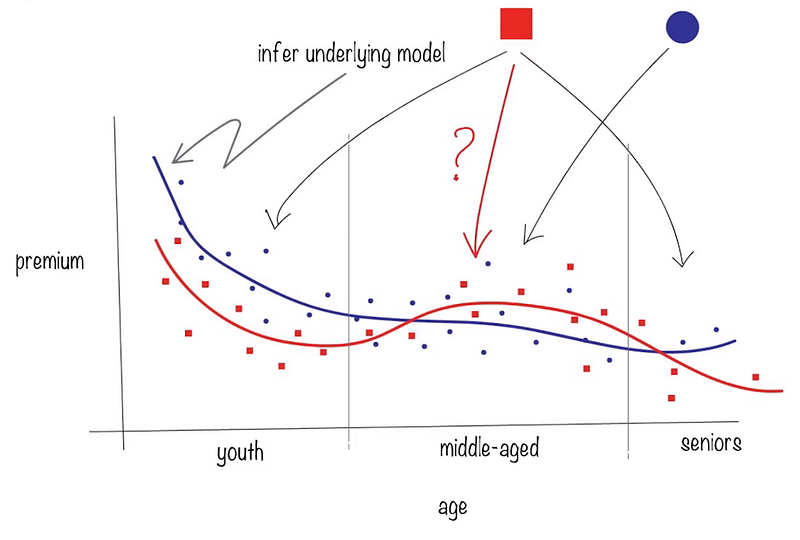
From the data, you can begin to infer the competitor’s business model
The difference may come from risk estimation, costs or a deliberate attempt to acquire a particular segment. The curve cannot decide between these explanations on its own, but it gives the investigation somewhere to begin. This is often the real value of machine learning in competitive analysis. It does not produce the competitor’s strategy as an answer. It shows where the observable behaviour stops matching our own.
The Gap Is the Question
Once the difference is visible, the company can ask better questions. Why are we more expensive in the middle-aged segment? Are we using a factor the competitor ignores, or is the competitor accepting more risk? Do we have higher costs? Are we protecting margin while the competitor is buying market share? Would adding more relevant variables improve our estimate, or would lowering the price simply hide a genuine difference in risk?
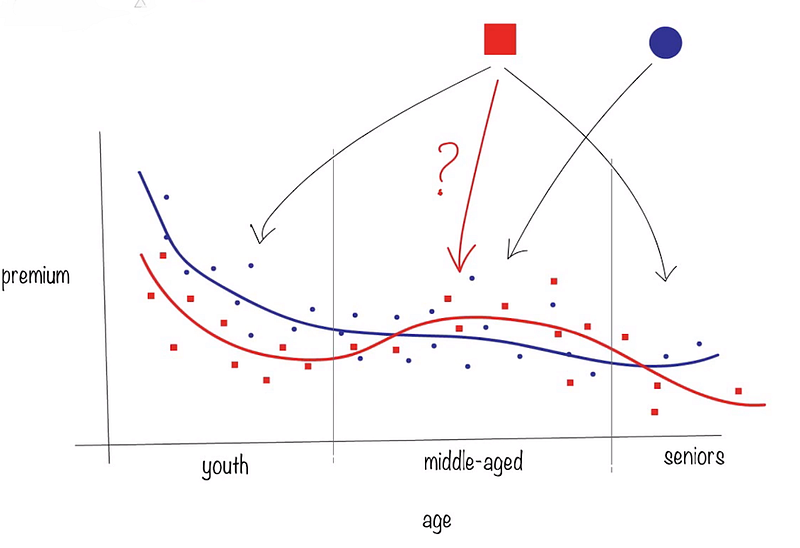
Possible business responses for making the premium more attractive to middle-aged drivers
The answer may be to change the model. It may be to change the product, improve efficiency or leave the price exactly where it is. A competitor’s lower premium is not proof that ours is wrong.
The purpose of the analysis is not imitation. It is to make the disagreement measurable.
The Market as an Interface
The same method can be applied beyond insurance. A company can observe delivery estimates, product recommendations, credit decisions, discounts or advertised prices and use them to approximate the behaviour of a hidden system.
The quality of the result depends on the quality of the observations. A sparse or biased sample will produce a distorted surface. If an important variable is missing, the model may attribute its effect to something else, while a change in the competitor’s strategy can make yesterday’s approximation unreliable. The model must therefore be treated as an instrument, not an oracle.
What it offers is a way to reason about a system that cannot be opened directly. The internal rules remain private, but repeated decisions reveal structure. Enough outputs can begin to describe the boundary of the machine that produced them. A competitor’s model may be hidden. Its consequences are not.
Comments